
When your Windows PC starts acting up—whether it’s crashing, freezing, or just behaving oddly—finding the root cause can feel like searching for a needle in a haystack. Fortunately, Windows includes a built-in tool that many users overlook: Reliability Monitor.
This powerful utility provides a timeline of your system’s stability and logs events like application crashes, hardware failures, and Windows updates. It’s a goldmine for troubleshooting.
🔍 What Is Reliability Monitor?
Reliability Monitor is a graphical interface that shows your system’s stability index over time, rated on a scale from 1 (very unstable) to 10 (very stable). It logs:
- Application failures
- Windows errors
- Hardware issues
- Driver installations
- Software updates
Each event is clickable, offering detailed information and links to possible solutions.
🚀 How to Launch Reliability Monitor
You can open Reliability Monitor in any language version of Windows using this universal command:
perfmon /rel
Steps:
- Press Windows + R to open the Run dialog.
- Type
perfmon /reland hit Enter. - The Reliability Monitor window will open, displaying a timeline of system events.
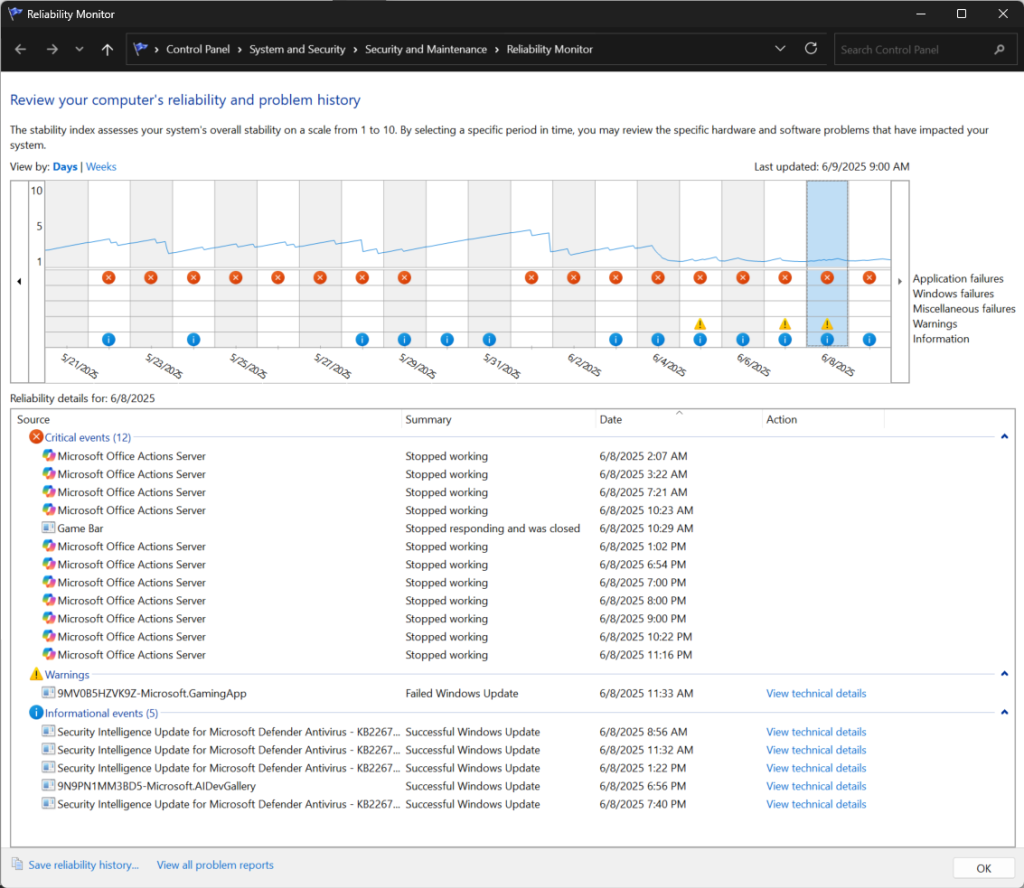
📊 Understanding the Interface
- Timeline: The graph shows daily stability scores. Red Xs indicate critical events, yellow warning signs show less severe issues, and blue info icons represent successful updates or installations.
- Details Pane: Click on any day to see a list of events. You can view technical details, check for solutions, or search online for more help.
🛠️ How to Use It for Troubleshooting
Here are a few practical ways to use Reliability Monitor:
1. Identify Recurring Crashes
If an app keeps crashing, you’ll see multiple red Xs for that app. Click the entries to find error codes or faulting modules.
2. Track Down When a Problem Started
Notice your PC started acting up last week? Scroll back to that date and look for any new software installs, driver updates, or system changes.
3. Correlate Issues with Updates
Sometimes a Windows update causes instability. Reliability Monitor shows exactly when updates were installed, helping you pinpoint the culprit.
4. Export Reports
You can take screenshots or use Event Viewer for deeper analysis, but Reliability Monitor itself doesn’t export reports directly. (The Save history option saves to a .XML format making a screenshot possibly easier to read)
💡 Pro Tips
- Combine Reliability Monitor with Event Viewer for deeper diagnostics.
- Use it regularly to monitor system health, not just when problems arise.
- If you’re helping someone remotely, ask them to run
perfmon /reland send a screenshot.
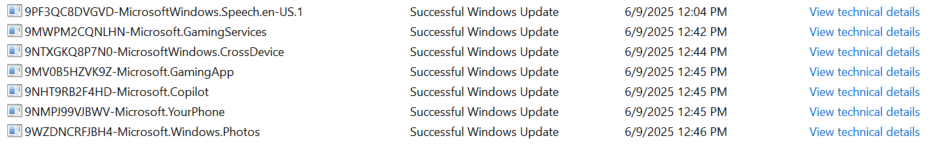
Example troubleshooting:
The screenshot above shows one of the Copilot processes having an issue although no user impact was experienced, after checking for app updates in the Windows Store this issue was resolved by teh newest version of the Copilot App.
Conclusion
Reliability Monitor is a hidden gem in Windows that can save you hours of guesswork. Whether you’re a casual user or a seasoned troubleshooter, it’s worth adding to your diagnostic toolkit.